在Vue中使用Echarts
实际的Vue项目开发中可能需要用到
Echarts来制作图表。本文将分享在VueCli3中使用Echarts的小经验。
环境配置
安装
将echarts与vue-echarts ( vue-echarts是基于echarts封装实现的一个组件库)
1 | npm i echarts vue-echarts --save |
引入
在main.js中导入包
1 | import ECharts from 'vue-echarts' |
引入一些echarts中比较常用的模块,其他主要模块到使用的组件内按需引入
1 | import "echarts/lib/chart/bar"; |
使用相关
基本使用
使用注册的全局组件chart即可
1 | <template> |
更为优雅的使用
由于实际开发时可能遇到不同的数据格式。我比较推荐将图表封装为一个与项目中实际数据结构相同的组件。
options的数据结构可以参考官网 https://www.echartsjs.com/zh/option.html#title
1 | <template> |
遇到的问题
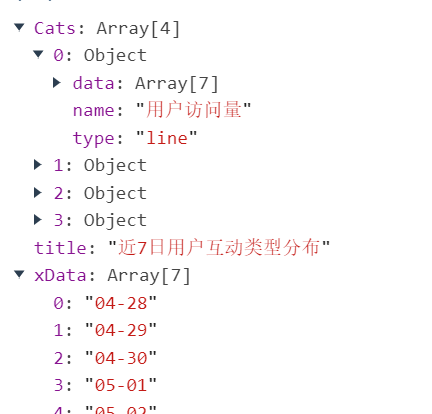
图表中的数据是由后端获取的,那么当图表绘制完成后,由于图表options中有些数据比较深,更新时可能会发生数据监听不到的问题。
我的解决办法是在在组件中加入一个vue侦听,侦听要发生变化的变量,例如上例中我加入了watch来侦听会发生变化的属性Cats
1 | watch:{ |
完整代码与效果
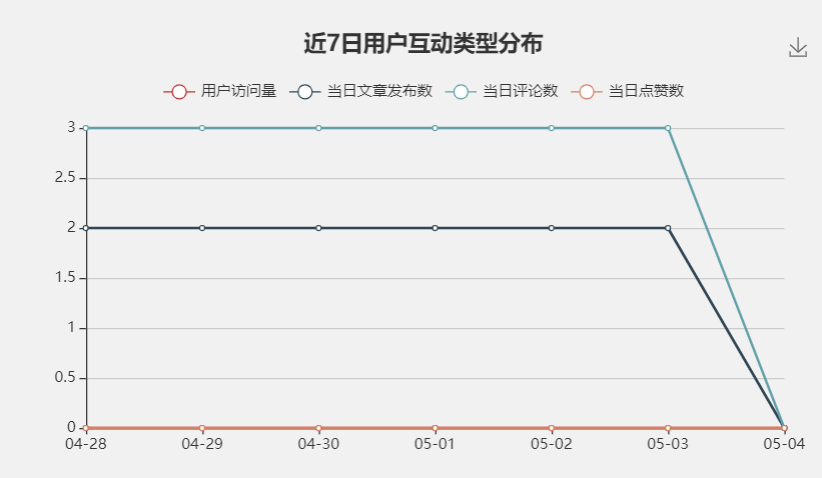
折线图
数据结构内容说明
组件代码
1 | <template> |
运行效果
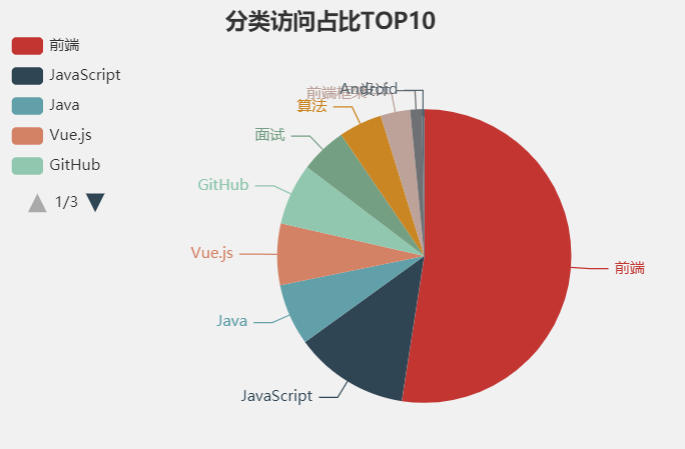
饼图
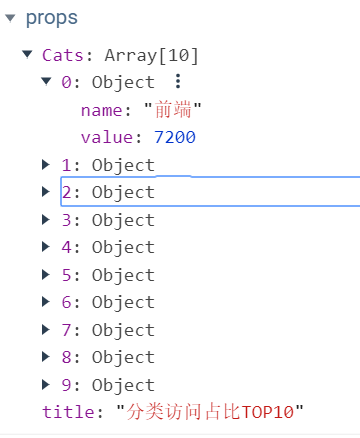
数据结构内容说明
组件代码
1 | <template> |
运行效果